
Pricing Differentials
Price differentials are the difference between a market price (NYMEX) for oil/gas and the price received when the actual physical production is sold at the sales point. Enersight has the capability to model these variations in pricing.
Important to Know
- Pricing differentials can be entered at the Well level and/or at the Facility level
- A differential can be applied at an asset that is not a Sales Point
- Differentials can be as a "% of Base" Adjustment or a Dollar amount.
- Differentials can be positive or negative.
- Differentials are additive as the production flows through the network
- As a default, differentials are in Dollar amount
- The differential is taken against the price record being referenced on the Sales Point for the appropriate product being referenced.
Escalation (%)
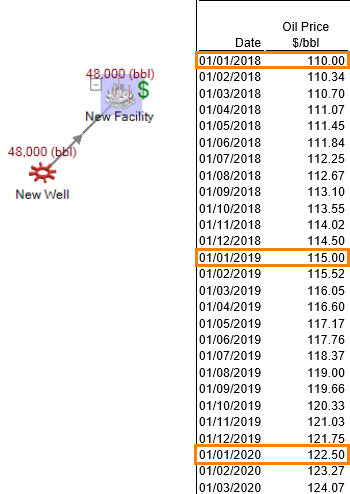
The Escalation field within the Price section is performed on a monthly basis based on the annual percentage. Escalation occurs only on the adjustment itself, not on the price as a whole. To better describe how escalation is calculated from this section, see example below:

Click image to expand or minimize.
Oil Price (consistent): $100/bbl
Price Adjustment: $10/bbl
Escalation: 50%
Click image to expand or minimize.
Set-Up
Click image to expand or minimize.
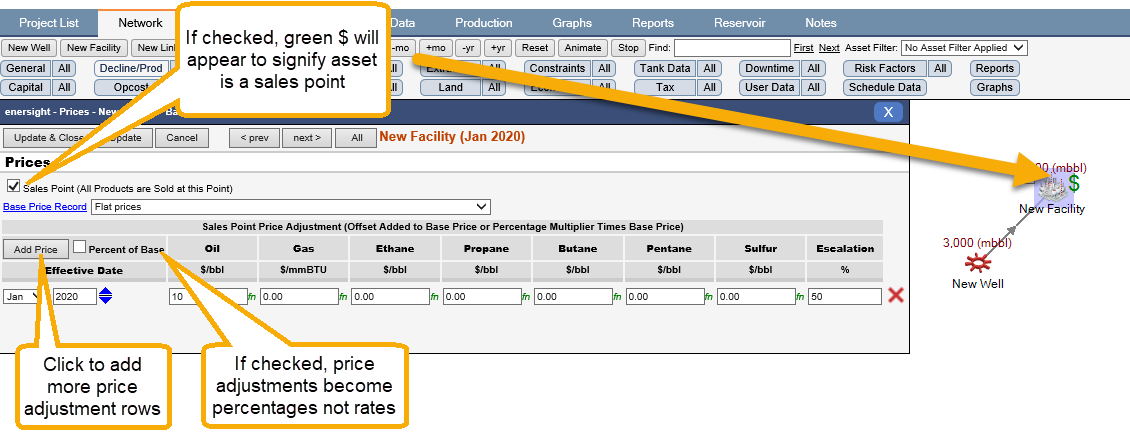
The green “$” in the top right corner of an asset indicates an asset is a Sales Point (which means a Base Price Record needs to be chosen for it). This also means production is considered ‘sold’ at this point, revenue is generated and no further transformation of the product may occur (e.g., fuel extraction).
Where the differential is related to the actual sales price deck, this can be referenced via the new function available from 2.14 release onwards of @SalesPrice(Asset, Production, [Index]).
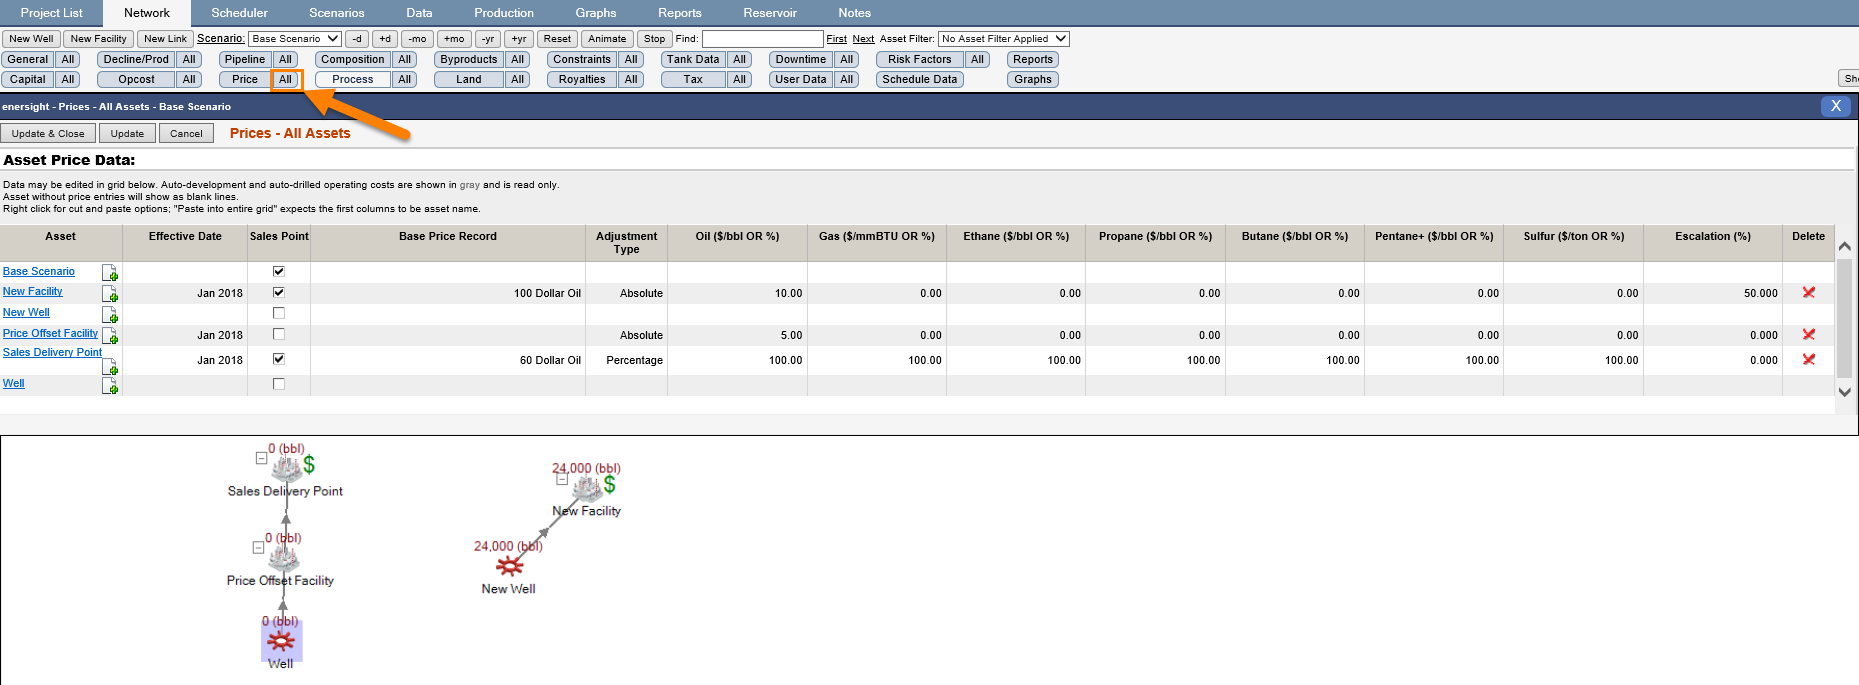
If a user wants to see all sales points and their associated price records, click the “All” button next to the “Price” data button.
Click image to expand or minimize.